A graph of everything you connect, not just your calendar.
In StillPoint the graph is not something you build. It is something that emerges as you link pages across projects, ideas, people, and journals. The calendar is a powerful backbone, but every page can be a node.
Connections are a natural side effect of writing.
The journal is a backbone
Day pages naturally link to projects, people, and decisions. That daily stream gives the graph a living timeline, but it is only one entry point.
Any page can connect
Project notes, meeting notes, reference pages, or personal ideas all become nodes. Link between them and the graph fills in the relationships.
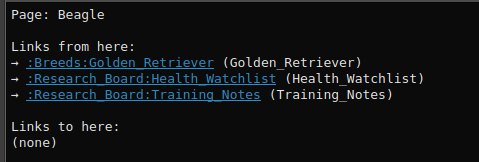
Linking is the smallest action
A link is just part of writing: client names, project names, concepts, passages, or ticket numbers become references with no metadata required.
Connections reveal patterns
The same project appears in meeting notes, a status update, and a decision log. The graph stitches those moments together without extra work.
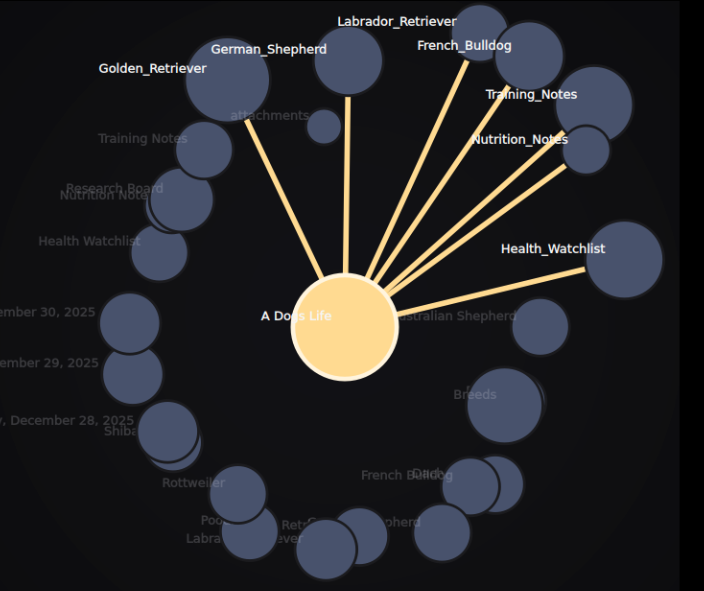
A living map of your thinking.
The graph grows naturally and stays out of the way until you need it. It shows how journal days connect to projects, how projects connect to ideas, and how your work connects to outcomes across the whole vault.
You do not maintain the graph. You just write, and the graph keeps up.
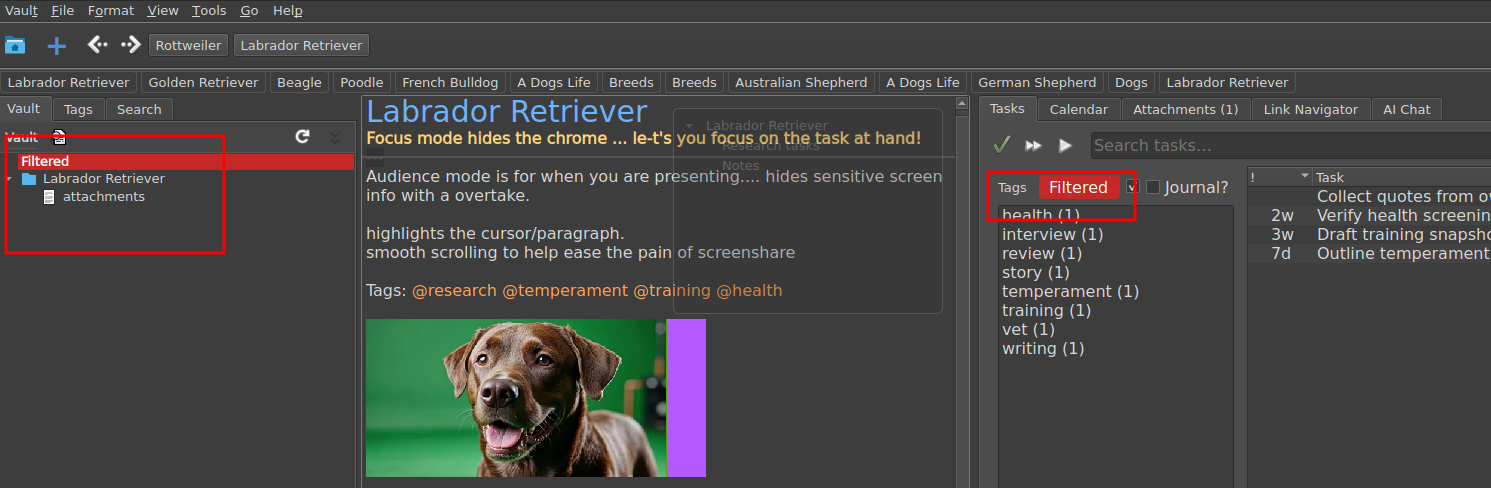
Filter the graph from any node.
Click a node and filter the graph to that context. StillPoint narrows the visible pages, tasks, and links so you get a dedicated project view without losing the larger structure. It feels like a focused workspace while still being connected to the rest of your vault.